
Table of Contents
1. Introduction
In this article, we’ll show different ways to capture a heap dump in Java.
A heap dump is a snapshot of all the objects that are in memory in the JVM at a certain moment. They are very useful to troubleshoot memory-leak problems and optimize memory usage in Java applications.
Heap dumps are usually stored in binary format hprof files. We can open and analyze these files using tools like jhat or JVisualVM. Also, for Eclipse users it’s very common to use MAT.
In the next sections, we’ll go through multiple tools and approaches to generate a heap dump and we’ll show the main differences between them.
2. JDK Tools
The JDK comes with several tools to capture heap dumps in different ways. All these tools are located under the bin folder inside the JDK home directory. Therefore, we can start them from the command line as long as this directory is included in the system path.
In the next sections, we’ll show how to use these tools in order to capture heap dumps.
2.1. jmap
jmap is a tool to print statistics about memory in a running JVM. We can use it for local or remote processes.
To capture a heap dump using jmap we need to use the dump option:
jmap -dump:[live],format=b,file=<file-path> <pid>
Along with that option, we should specify several parameters:
- live: if set it only prints objects which have active references and discards the ones that are ready to be garbage collected. This parameter is optional
- format=b: specifies that the dump file will be in binary format. If not set the result is the same
- file: the file where the dump will be written to
- pid: id of the Java process
An example would be like this:
jmap -dump:live,format=b,file=/tmp/dump.hprof 12587
Remember that we can easily get the pid of a Java process by using the jps command.
Keep in mind that jmap was introduced in the JDK as an experimental tool and it’s unsupported. Therefore, in some cases, it may be preferable to use other tools instead.
2.2. jcmd
jcmd is a very complete tool that works by sending command requests to the JVM. We have to use it in the same machine where the Java process is running.
One of its many commands is the GC.heap_dump. We can use it to get a heap dump just by specifying the pid of the process and the output file path:
jcmd <pid> GC.heap_dump <file-path>
We can execute it with the same parameters that we used before:
jcmd 12587 GC.heap_dump /tmp/dump.hprof
As with jmap, the dump generated is in binary format.
2.3. JVisualVM
JVisualVM is a tool with a graphical user interface that lets us monitor, troubleshoot, and profile Java applications. The GUI is simple but very intuitive and easy to use.
One of its many options allows us to capture a heap dump. If we right-click on a Java process and select the “Heap Dump” option, the tool will create a heap dump and open it in a new tab:

Notice that we can find the path of the file created in the “Basic Info” section.
Starting from JDK 9, Visual VM is not included in the Oracle JDK and Open JDK distributions. Therefore, if we’re using Java 9 or newer versions, we can get the JVisualVM from the Visual VM open source project site.
3. Capture a Heap Dump Automatically
All the tools that we’ve shown in the previous sections are intended to capture heap dumps manually at a specific time. In some cases, we want to get a heap dump when a java.lang.OutOfMemoryError occurs so it helps us investigate the error.
For these cases, Java provides the HeapDumpOnOutOfMemoryError command-line option that generates a heap dump when a java.lang.OutOfMemoryError is thrown:
java -XX:+HeapDumpOnOutOfMemoryError
By default, it stores the dump in a java_pid<pid>.hprof file in the directory where we’re running the application. If we want to specify another file or directory we can set it in the HeapDumpPath option:
java -XX:+HeapDumpOnOutOfMemoryError -XX:HeapDumpPath=<file-or-dir-path>
When our application runs out of memory using this option, we’ll be able to see in the logs the created file that contains the heap dump:
java.lang.OutOfMemoryError: Requested array size exceeds VM limit
Dumping heap to java_pid12587.hprof ...
Exception in thread "main" Heap dump file created [4744371 bytes in 0.029 secs]
java.lang.OutOfMemoryError: Requested array size exceeds VM limit
	at com.maixuanviet.heapdump.App.main(App.java:7)
In the example above, it was written to the java_pid12587.hprof file.
As we can see, this option is very useful and there is no overhead when running an application with this option. Therefore, it’s highly recommended to use this option always, especially in production.
Finally, this option can also be specified at runtime by using the HotSpotDiagnostic MBean. To do so, we can use JConsole and set the HeapDumpOnOutOfMemoryError VM option to true:
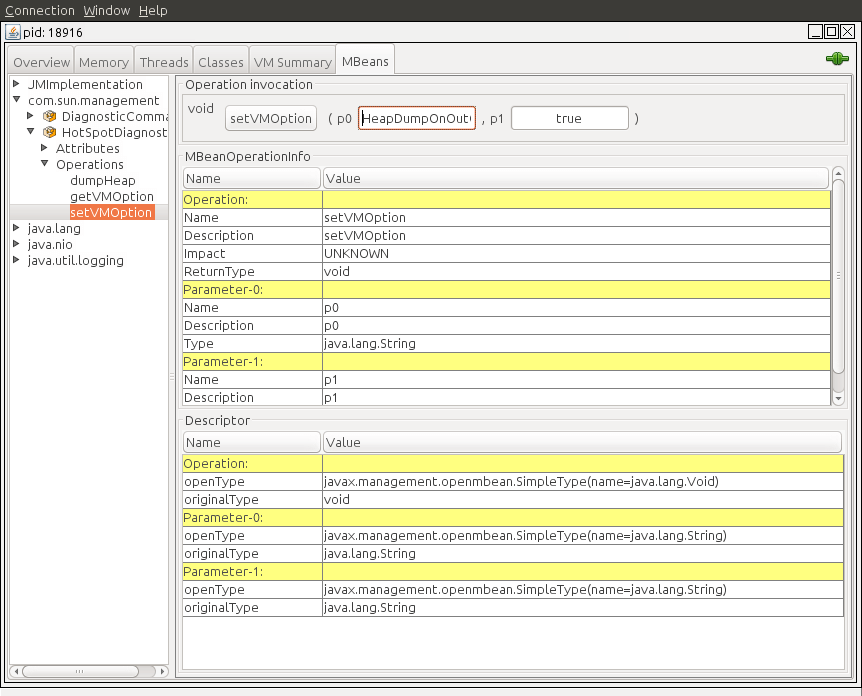
We can find more information about MBeans and JMX in this article.
4. JMX
The last approach that we’ll cover in this article is using JMX. We’ll use the HotSpotDiagnostic MBean that we briefly introduced in the previous section. This MBean provides a dumpHeap method that accepts 2 parameters:
- outputFile: the path of the file for the dump. The file should have the hprof extension
- live: if set to true it dumps only the active objects in memory, as we’ve seen with jmap before
In the next sections, we’ll show 2 different ways to invoke this method in order to capture a heap dump.
4.1. JConsole
The easiest way to use the HotSpotDiagnostic MBean is by using a JMX client such as JConsole.
If we open JConsole and connect to a running Java process, we can navigate to the MBeans tab and find the HotSpotDiagnostic under com.sun.management. In operations, we can find the dumpHeap method that we’ve described before:
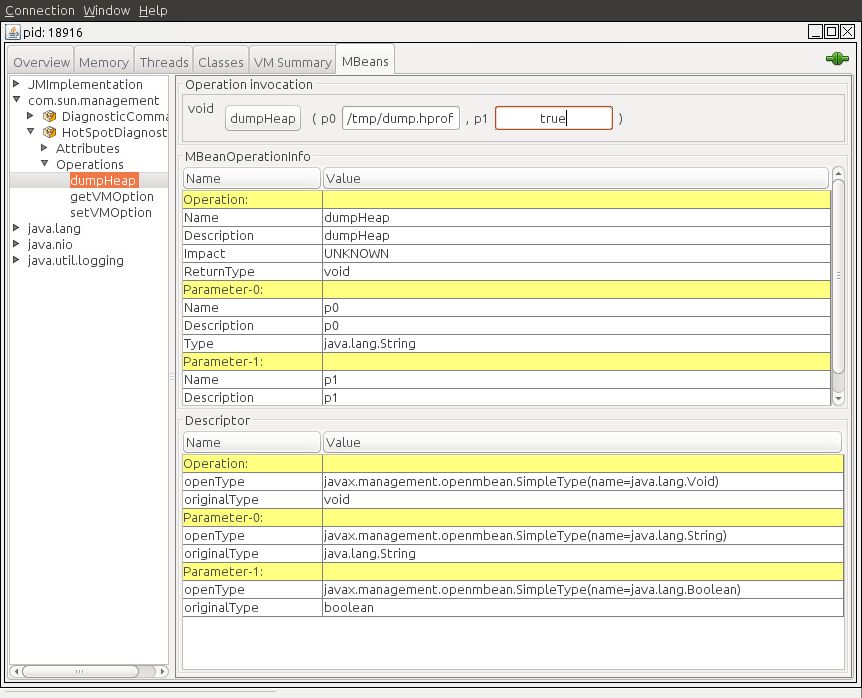
As shown, we just need to introduce the parameters outputFile and live into the p0 and p1 text fields in order to perform the dumpHeap operation.
4.2. Programmatic Way
The other way to use the HotSpotDiagnostic MBean is by invoking it programmatically from Java code.
To do so, we first need to get an MBeanServer instance in order to get an MBean that is registered in the application. After that, we simply need to get an instance of a HotSpotDiagnosticMXBean and call its dumpHeap method.
Let’s see it in code:
public static void dumpHeap(String filePath, boolean live) throws IOException {
    MBeanServer server = ManagementFactory.getPlatformMBeanServer();
    HotSpotDiagnosticMXBean mxBean = ManagementFactory.newPlatformMXBeanProxy(
      server, "com.sun.management:type=HotSpotDiagnostic", HotSpotDiagnosticMXBean.class);
    mxBean.dumpHeap(filePath, live);
}
Notice that an hprof file cannot be overwritten. Therefore, we should take this into account when creating an application that prints heap dumps. If we fail to do so we’ll get an exception:
Exception in thread "main" java.io.IOException: File exists
	at sun.management.HotSpotDiagnostic.dumpHeap0(Native Method)
	at sun.management.HotSpotDiagnostic.dumpHeap(HotSpotDiagnostic.java:60)
5. Conclusion
In this tutorial, we’ve shown multiple ways to capture a heap dump in Java.
As a rule of thumb, we should remember to use the HeapDumpOnOutOfMemoryError option always when running Java applications. For other purposes, any of the other tools can be perfectly used as long as we keep in mind the unsupported status of jmap.
As always, the full source code of the examples is available over on GitHub.