
Table of Contents
Node.js is a computer language based on JavaScript. When learning a new language, finding commonalities between other computer languages can be helpful. This article will help readers understand the structural differences related to installing modules, defining variables and visualizations.
1. Node.js structural comparisons
In this tutorial, we will be comparing Node.js with C/C++. In this tutorial will be installing modules, defining variables, and visualizations. Applying these concepts might be beneficial in various situations.
2. Prerequisites
- Windows device.
- Previous knowledge of installing modules.
- Some knowledge of interpreting graphs and similar visualizations.
- Prior knowledge of math and statistics.
- Installations of the following:
- Kali Linux.
- Node.js application.
- Plotly account.
- Some coding knowledge or experience.
Once most of the prerequisites are met, we can begin.
3. Node.js
Node.js is written in a unique structure. One characteristic to consider is the steps to create or add modules into Node.js. As each coding language includes its sequenced procedure, Node.js also involves flexible options when defining variables. We can find modules on open-source websites.
In Node.js, folders and JavaScript files are known to hold modules. Modules inside the node_module folder can be used in the Node.js application. One method to install Node.js modules is shown below. Alternatively, i can be substituted for install.
npm install plotly
A branched-out path directory will look similar to the picture below.

Screen capture
Remember to use the npm rebuild command. A module is installed after this command is entered. If this command is not entered, the installation is incomplete and cannot be included in Node.js scripts.
Node.js is structured uniquely to define a variable properly. When using the global function, the function can be included in other modules optionally. For example, without a global function to define a variable, the variable will be named undefined.
An example is shown below.
var name = 'maixuanviet.com';
Output:
undefined
When adding global before the variable name, the value becomes defined. Defined global variables can be applied to many data types and used with various Node.js modules.
The following are a few examples.
global.name = 'maixuanviet.com';
global.number = [0,-10,3.14,-3.14];
global.alphanum = [name, number];
Output:
'maixuanviet.com'
[ 0, -10, 3.14, -3.14 ]
[ 'section.io', [ 0, -10, 3.14, -3.14 ] ]
Handling different data types inside an individual variable might need a specific structure. In this case, square brackets surround values.
Visualizations in Node.js are generated with Plotly. To graph with Plotly, an account is required. The concept of defining variables is also applied to the Node.js script below. Replace [enterusername] and [enterkey] with the login information received during Plotly account registration.
One important thing to note, generating random numbers is the option to seed. The term seed in this tutorial refers to repeating the same script and receiving the same outcomes. If the script does not have a set seed, numbers generated from the script will be different each time.
global.plotly = require('plotly')("[enterusername]", "[enterkey]");
global.i = [];
global.y = [];
global.x = [];
for (i = 0; i < 50; i ++) {
	y[i] = Math.random();
	x[i] = Math.random() + 1;
}
global.trace1 = {
  y: y,
  type: "box"
};
global.trace2 = {
  x: x,
  type: "box"
};
global.data = [trace1, trace2];
global.graphOptions = {filename: "basic-box-plot", fileopt: "overwrite"};
plotly.plot(data, graphOptions, function (err, msg) {
    console.log(msg);
});
Output:
{
  streamstatus: undefined,
  url: 'https://chart-studio.plotly.com/~pkalynan/0',
  message: "High five! You successfully sent some data to your account on plotly. View your plot in your browser at https://chart-studio.plotly.com/~pkalynan/0 or inside your Plotly account where it is named 'basic-box-plot'",
  warning: '',
  filename: 'basic-box-plot',
  error: ''
}
The image below is a frozen portion of the interactive graphic.
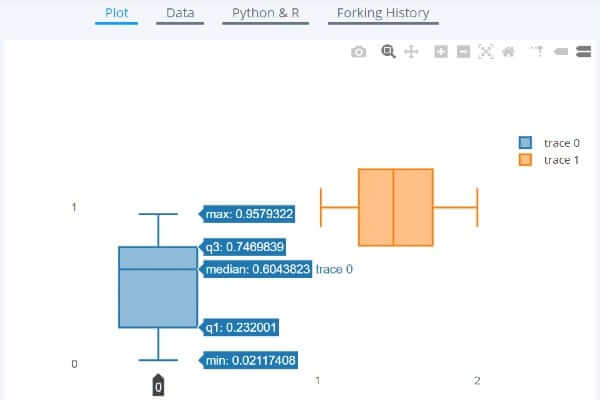
Screen capture
By visiting the following link, additional options to observe the data can be visualized. One example is converting any given Node.js script to other programming languages such as Python, R, and JSON. Another feature includes a mouse-over technique to display labels.
A general overview of the visual from the random number generator considers the scale and the physical positioning of the box plots. The vertical box plot included data points under the value of one.
The graph included most measures of central tendency variables, although the mean or average remained unavailable. The second graph positioned to the right is horizontal. Both graphs can display medians.
C
In this portion of the tutorial, tips on the procedural process behind Matplotlib-cpp installations, defining variables, and applying these procedures to visualizations are discussed. The following is a frequently used procedure to install a C module.
Matplotlib-cpp can be installed accordingly. After entering an installation command, a request to install other required dependent modules can be accepted or declined. At this step, enter y to complete installations with the command provided below.
apt-get install python-matplotlib python-numpy python2.7-dev
Next, define variables in a C/C++ environment. A text editor in the command line can help create a C file. For example, nano is a built-in text editor involved in the creation of C files.
nano test.c
The C script is shown below.
#include <stdio.h>

int main(){
  static int n = 500000.00;
  printf("Numerical variable is %d.", n);
  return 0;
};
Compilation of the script above must be done before running the C script. Enter sudo at the start of every command when not in ROOT mode.
Additional observations to note are gcc helps create C files, and -o creates a name of the output file. We open the output file with the second command with the path directory symbol and the file name.
gcc test.c -o test
./test
Output:
Numerical variable is 500000.
Visualizations display data in different forms. To graph, Matplotlib-cpp can display many types of graphs. However, simplicity is key.
As stated in Matplotlib-cpp documentation, installing Python is necessary to create graphs. Start by creating a C++ file with nano. The script below is saved as flip.cpp.
#include <cmath>
#include "matplotlibcpp.h"

using namespace std;
namespace plt = matplotlibcpp;

int main()
{
    int n = 500000;
    vector<double> x(n),y(n);
    for(int i=0; i<n; ++i) {
        double t = 2*M_PI*i/n;
        x.at(i) = 16*sin(t)*sin(t)*sin(t);
        y.at(i) = -(13*cos(t) - 5*cos(2*t)) - (-(2*cos(3*t) - cos(4*t)));
    }

    plt::title("Soundwave Curves");
    plt::plot(x, y, "y-", x, [](double d) { return 12.5+abs(sin(d)); }, "bo");

    plt::show();
}
Enter the command below to compile the cpp file written above. g++ is designed to create c++ files. The command must also contain the Python library directory. To run the newly created file, enter the second command underneath g++.
g++ flip.cpp -I/usr/include/python3.9 -lpython3.9 -o maixuanviet.com
./maixuanviet.com
If kex is open, the image should appear similar to the picture below.
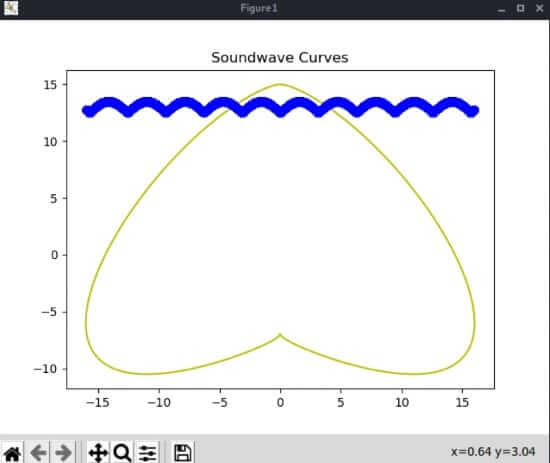
Screen capture
To recap the graph shown above is a mixture of many forms of sine and cosine waves. These trigonometric functions are also used to measure sound.
The graph forms a rotated version of a geometric shape symbolizing one heart. Colors can be changed accordingly.
4. Conclusion
As described, Node.js and C/C++ offer several features. Based on preferences and purposes, either computer language can complete tasks. Deciding which computer language to use depends on a case-to-case basis.
5. Takeaways
- In Node.js, defining global variables starts with
global.followed by a variable name in a single statement. - Plotly graphs generated with Node.js are sent to a separate interactive browser window. Interactive features include script conversions and displaying labels.
- In C/C++, files are required to be compiled before running files.
- Matplotlib-cpp graphs are displayed with
kex.
6. References
Happy coding!