
Table of Contents
Node.js is a robust technology stack with a rich ecosystem. However, debugging Node.js applications remains a difficult task, since they can fail without any error message. Using Chrome Dev Tools is a simple solution to finding errors in your code.
1. Introduction
Node.js is a fast, asynchronous and event driven server-side JavaScript technology. You can read why Node.js is popular among developers here.
A debugger is a program that is used to inspect a program as it runs. It enables running the code line-by-line and following the execution process. In the process, you can see the code as a flow chart and logically interpret it. This enables you to find bugs more easily.
The most popular way JavaScript and Node developers track bugs in their programs is by printing data to the console. They use methods like console.log() and console.debug(). Although these methods can be helpful, they require a lot of manual effort and are not foolproof. Suppose you have a large app, how many console.log() statements would you need? Hundreds, perhaps.
Logging sensitive information can occur, exposing your app to malicious exploitations and data breaches may also occur. Debuggers come handy in a situations like this. They help track bugs without exposing your app to security threats.
Even so, Node.js apps can fail without error messages. This occurs mainly in cases where error handling is not employed. Debuggers can watch behaviors of specific objects throughout program execution by adding breakpoints in a program. Breakpoints are locations in your code where you pause execution and examine various factors. By watching objects, you can evaluate their values and type as the execution goes on.
Although Node.js comes with a built-in debugger, it’s not very flexible. It is a CLI-based debugger where typing things is not an option. Google Chrome DevTools is a non-CLI debugger alternative. It requires no additional installation if you are using a Chromium-based browser like Google Chrome, Chromium and Microsoft Edge, etc.
2. Prerequisites
Note: You will need a chromium based browser installed in your computer. You can download Google Chrome from here.
By the end of this article, you will be able to debug your Node.js app in 4 easy steps.
2.1. Step 1 – Set up your app for debugging.
1.a – Set up a local app for debugging.
Run your Node.js app with the inspect flag like this: node --inspect <filename>. Example:
$ node --inspect server.js
Running your app with the --inspect flag allows third-party debuggers to attach to your app and access all the app files.
You should have an output that looks like this:
Debugger listening on ws://127.0.0.1:9229/31dc8b93-3f2c-4352-aa7b-e9357bbabccc
For help, see: https://nodejs.org/en/docs/inspector
Listening on http://127.0.0.1:8000
1.b – Set up a remote app for debugging.
If you want to debug your remote in your browser, it’s best to use SSH tunnels. However, there are security risks associated with allowing remote access to privileged services. These include unauthorized database access, website defacement, and phishing attacks.
Let’s say that your app is running on remote machine remote.machine.com, run it with the inspect flag in your remote machine . node --inspect <filename>
Setup an SSH tunnel to connect to your remote machine. On your local machine, by running:
$ ssh -L 9221:localhost:9229 user@remote.machine.com
The port 9221 on your local machine will be forwarded to port 9229 on remote.machine.com. You can change the local port if it’s occupied by another process.
Note: When running an app in debug mode, security should be considered. Exposing the debug port poses security threats to your app. By default, 127.0.0.1:9229 is the debug port. If the debugger is bound to a public address, any client reaching your IP address can connect to it without any restriction. At that point, your code, data, and device are at risk.
2.2. Step 2 – Open Chrome DevTools
Open your browser and open the URL: chrome://inspect. If you are using Microsoft Edge, edge://inspect will open the same page. The page looks something like this:
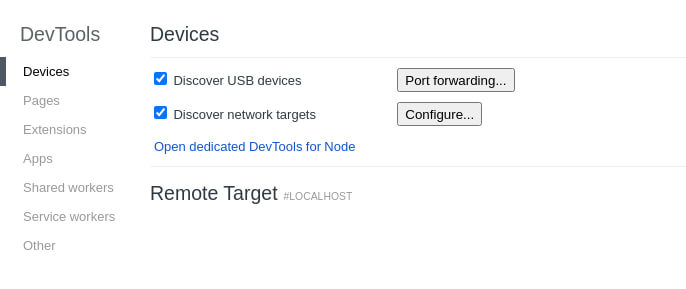
If you are debugging a remote app, after setting up an SSH tunnel, you need to add your local port to discoverable targets. To do this, make sure the Discover network targets checkbox is checked. Click the Configure… button and add your IP address and port.
To open DevTools dedicated to Node.js debugging, click Open dedicated DevTools for Node.
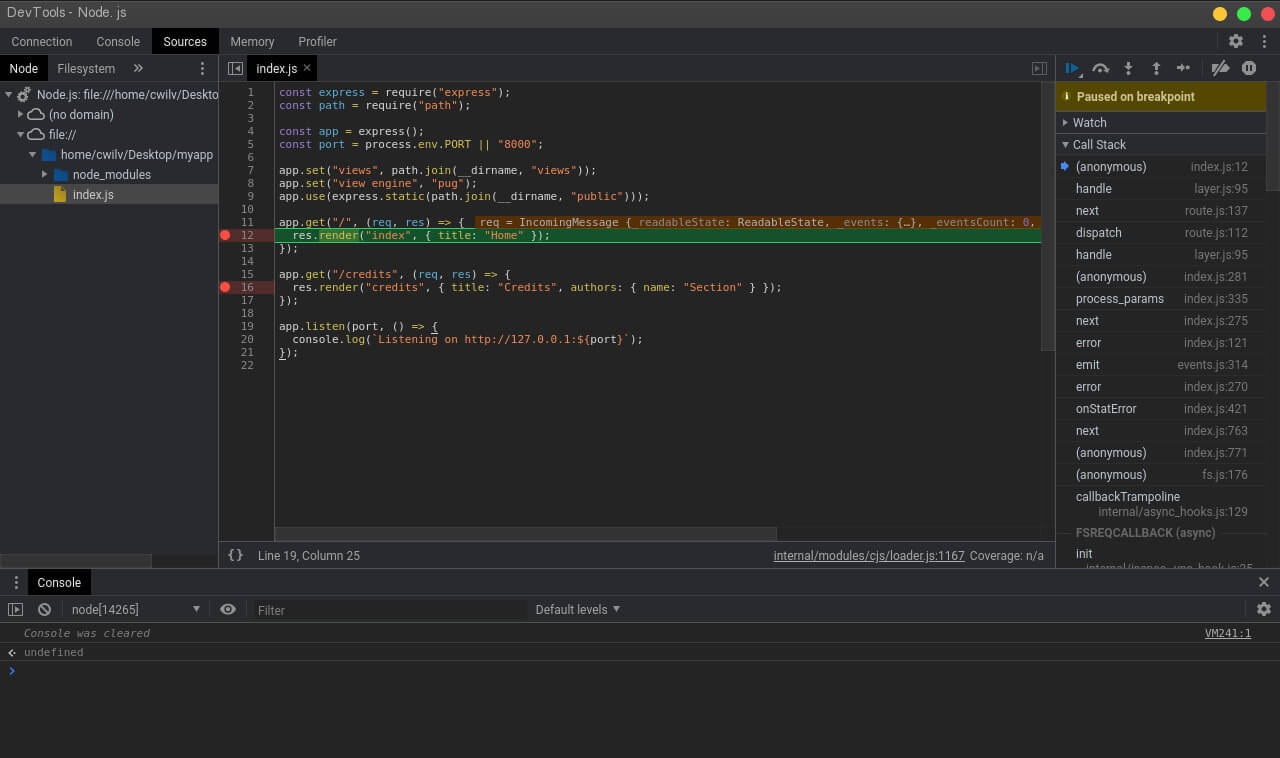
2.3. Step 3 – Set Breakpoints
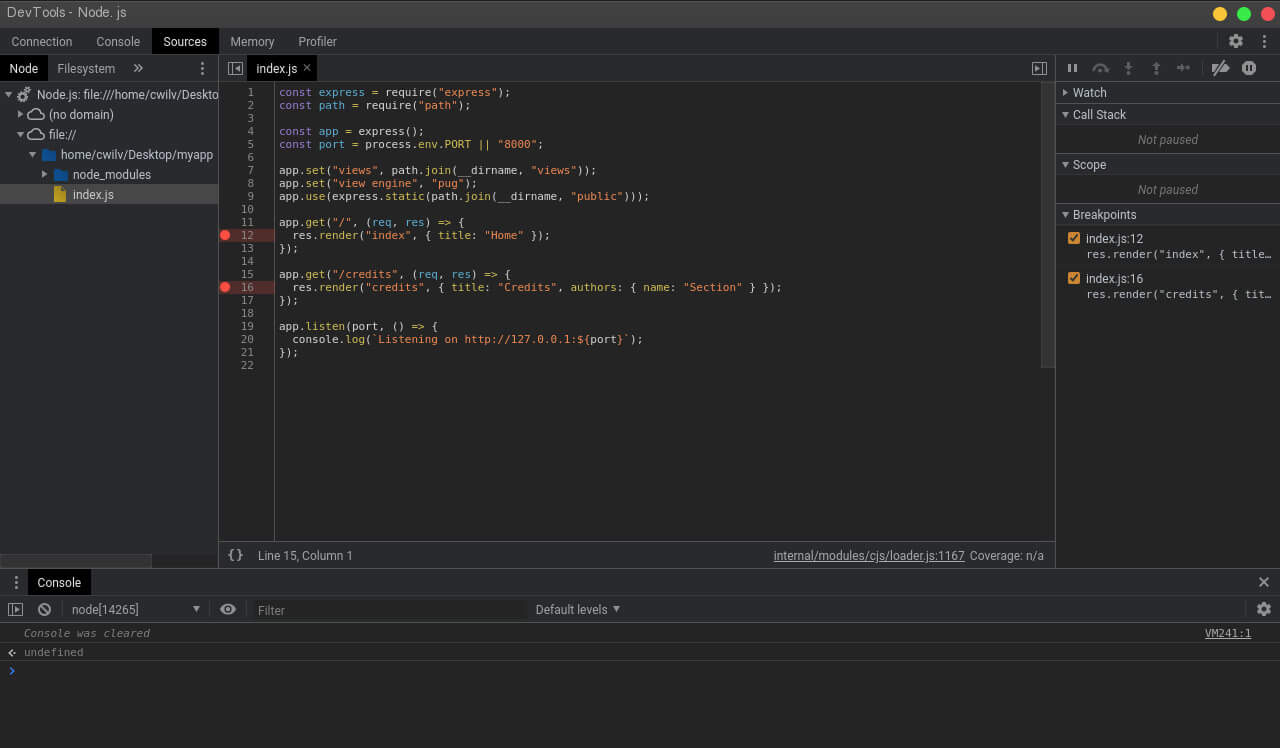
To debug your app, navigate to the Sources tab. This is where you will be editing your code. Expand the file tree on the left and click the file you want to debug. The selected file opens in the central part of the sources tab. You can open multiple files for debugging.
Note: Editing code in DevTools does not change your local or remote files. To make permanent changes you must edit your local or remote files.
Add breakpoints to your code by clicking on the left side of the line number. Once set, a red dot will appear on those lines. On the right panel in the Sources tab, you can watch objects and activate/deactivate breakpoints. To watch a variable, add a variable defined in your code in the Watch tab. In the Scope tab, you can view the local and global variables currently defined.
2.4. Step 4 – Reload app and Debug
To step through to your code, navigate to the app URL and refresh the app. You can also open the URL in a new window. Upon hitting the reload button, the DevTools window should come into focus. If it doesn’t, you can navigate to the DevTools window manually. You can also restart the app instance on a terminal using the curl command. Open a new terminal or tab and run:
$ curl http://127.0.0.1:8000
If you want to run some JavaScript code on the built-in JavaScript console, press Esc to open the console, or open the Console tab in DevTools.
The debugger pauses on your breakpoints while printing to the console, watch, call stack, and scope tabs. You can resume code execution using the resume button right above the Watch tab.
3. Conclusion
We have looked at how you can debug a local and remote app using Chrome DevTools. In DevTools, you can observe variable changes and track bugs more easily without printing to the console through watch variables and breakpoints. This also helps prevent security loopholes. By not logging sensitive data, data breaches and hacking can’t occur.
Alternatively, if you’d like to debug a Node.js app straight from Visual Studio Code, check out the following article.