
Table of Contents
billboard.js is a JavaScript library that facilitates data visualization in charts and is based on D3 V4+. billboad.js makes it easier for developers to visualize data instantly without needing to write a lot of boilerplate code.
1. Prerequisites
- Node.js installed on your computer.
- Npm installed on your computer.
- Javascript and HTML knowledge.
2. Project setup
- Create a project directory named
charts. - Within the
chartsdirectory created above, create a new HTML file nameindex.html.
2.1. Installing billboard.js
billboard.js can be added to a project in two ways:
- Manual download Download
billboad.jsfiles from the billboard.js official website. Add the CSS and Javascript files downloaded into thechartdirectory we created above.
In the index.html, add the code snippet below into the header section.
   <!-- Load D3.js -->
    <script src="https://d3js.org/d3.v5.min.js"></script>

    <!-- Load billboard.js -->
    <script src="billboard.js"></script>

    <!-- Load style -->
    <link rel="stylesheet" href="billboard.css">
- Installation through npm. To install
billboard.jsinto our project through npm, we must initialize npm in the root directory of our project.
- Change to current terminal directory to our project directory.
- Execute the command below to create
package.jsonandpackage.lock.jsonfiles which are used by Node.js to manage external libraries added to Node.js applications.
$ npm init
To install billboard.js into our project through npm, execute the command below.
$ npm install billboard.js
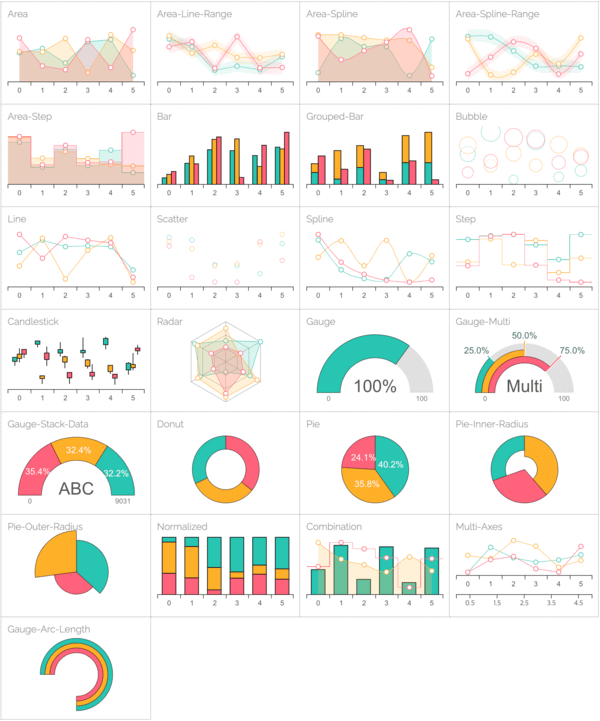
2.2. Supported chart types in billboard.js
billboard.js supports a variety of charts. Below are certain chart types supported by billboard.js.
2.3. Creating charts using billboard.js
In this section, we are going to create a simple chart using billboard.js.
- Create an HTML file names
chart.htmlin the project folder we created above. - Add the code snippet below to the
chart.htmlfile.
   <!DOCTYPE html>

    <title>billboard.js application</title>

    <head>
    <!-- loading billboard.js styles from the cdn -->
    <link rel="stylesheet" href="https://cdn.jsdelivr.net/npm/billboard.js/dist/billboard.min.css">

    <!--Loading D3.js -->
    <script src="https://d3js.org/d3.v5.min.js"></script>

    <!-- Loading billboard.js scripts from the cdn -->
    <script src="https://cdn.jsdelivr.net/npm/billboard.js/dist/billboard.min.js"></script>
    </head>
    <body>

    </body>

    </html>
Create a div with an id charting within the body tag in the chart.html file we created above.
<div id="charting"></div>
Create a file named charting.js in the root project directory and add the code snippet below.
bb.generate({
    bindto: "#charting",
    data: {
        columns: [
            ["Java", 10, 320, 400, 210, 90, 210],
            ["Python", 310, 200, 210, 24, 220, 30]
        ],
        types: {
          Java: "area-spline",
          Python: "step"
        },
        colors: {
          Java: "blue",
          Python: "green"
        }
    }
    });
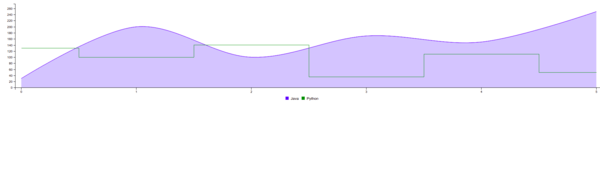
bb.generate({})generates a chart with the arguments passed to it.bindto: "#charting"holds thedivid where the chart will be displayed in our HTML file.dataholds an object with all the information required to create the chart.columnshold the data from which the chart will be plotted.typesindicates the type of chart to be used. In our chart, we are using a line chart for Java and a step-chart for Python.colorsspecifies the color in which each data will be presented.
- Add the
charting.jsscript to thechart.htmlfile at the bottom of thebodytag.
<script src="charting.js"></script>
The chart shown below is plotted.
2.4. Displaying categorical data using billboard.js
When a large set of data is to be displayed, then displaying them in categories becomes handy.
- Create a
divwith idcategoricalin thechart.htmlfile we created earlier. - Create a Javascript file named
categorical.jsin the project directory. - Add the code snippet below to the file created above.
   var chart = bb.generate({
    bindto: "#categorical",
    data: {
    x: "x",
    columns: [
        ["x", "www.siteone.com", "www.sitetwo.com", "www.sitethree.com", "www.sitefour.com"],
        ["downloads", 50, 100, 200, 600],
        ["uploads", 80, 110, 150, 220]
    ],
    groups: [
      [
        "downloads",
        "loading"
      ]
    ],
        colors: {
          downloads: "blue",
          uploads: "green"
        },
    type: "bar",
    },
    axis: {
        x: {
        type: "category"
        }
    },
    bindto: "#categoryData"
    });
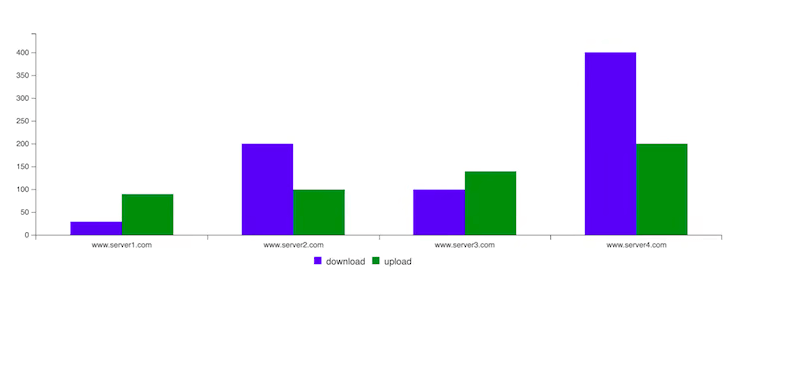
The categorical data above is displayed in the chart as shown in the image below.
2.5. Chart themes in billboard.js
billboard.js comes with various themes, some of which include:
graphdatalabinsightdefault
To use the above themes, load the CSS file provided by billboard.js into your HTML file as shown below.
<link rel="stylesheet" href="
https://naver.github.io/billboard.js/release/latest/dist/theme/insight.css">
3. Conclusion
Now that you have learned how to integrate billboard.js into a Node.js application, explore the available charts and themes from the billboard.js official docs.
Happy coding!