
Table of Contents
Docker is a very popular tool used by many developers today. If you have Docker on your machine, you do not need to have Node.js installed to build Node.js apps. Running a Node.js app in Docker can be done easily.
In this article we will look at how we can debug a Node.js app running in a Docker container.
1. Introduction
Docker is used to build, run, and deploy apps in containers. This way, all libraries, and dependencies can be packaged and deployed as a single package.
As we mentioned above, you don’t need to install Node.js to run or build a Node.js app. You just need Docker.
If you have ever worked on a project in a team, you’re probably familiar with the “It works on my machine” problem. Docker took care of that too.
If you are new to Docker, I recommend you go through the following articles. They will give you better understanding on Docker.
- [A Brief History of Container Technology/engineering-education/history-of-container-technology/)
- Understanding Docker Concepts
- Getting Started with Docker
- Building a Node.js Application Using Docker
2. Prerequisites
To follow along with this tutorial, you will need the following:
- A Docker installation on your machine. For Linux users, you can install it using this guide.
- Visual Studio Code and/or a chromium-based browser such as Google Chrome.
- Basic knowledge of Node.js and Docker concepts.
By the end of this tutorial, you will be able to debug your Node.js app using VS Code and Chrome DevTools.
3. Step 1 – Update your Dockerfile configuration
If you have been running your Node.js apps in a Docker container, your Dockerfile probably looks something like this:
FROM node:14
WORKDIR /usr/src/app
COPY package*.json ./
RUN npm install
COPY . .
EXPOSE 3000
CMD [ "node", "index.js" ]
To be able to debug a Node.js app running in a Docker container, you need to update your run command.
Edit your Dockerfile CMD entry to look like this:
CMD ["npm", "start"]
4. Step 2 – Update your package.json configuration
The next step is to add a Node.js debug command under the scripts part of your package.json file.
Your scripts part of your package.json probably looks like this:
  "scripts": {
    "test": "echo \"Error: no test specified\" && exit 1"
  },
Edit it to look like this:
  "scripts": {
    "test": "echo \"Error: no test specified\" && exit 1",
    "start": "node --inspect=0.0.0.0 index.js"
  },
You have added a script named “start” that executes “node --inspect=0.0.0.0 index.js”.
Note: The normal
--inspectflag used in Node.js can’t be used since the app is running in a container and not directly on your machine. Basically, your app is running in a “remote” machine. We use--inspect=0.0.0.0instead to allow access from any IP address.
5. Step 3 – Set up Nodemon
This step is optional. It’s suitable for a development environment.
Nodemon is a tool to restart your app every time a change is made to your app. It is very useful in a development environment.
To use Nodemon with your app, you need to edit your Dockerfile and package.json. Add this line below the RUN npm install line.
RUN npm install -g nodemon
Change node --inspect=0.0.0.0 index.js to nodemon --inspect=0.0.0.0 index.js in your package.json.
  "scripts": {
    "test": "echo \"Error: no test specified\" && exit 1",
    "start": "nodemon --inspect=0.0.0.0 index.js"
  },
You can use
--inspect-brk=0.0.0.0to pause code execution until a debugger is attached.
6. Step 4 – Debug with Chrome DevTools
Build your Docker image.
$ docker build -t <your-image-name> .
Since your app will be running in a container, you need to map the ports inside the container to ports on your machine.
$ docker run --rm -d -p 3000:3000 -p 9229:9229 image:tag
The above command runs your container in detached mode (-d) and maps remote ports 3000 and 9229 to localhost ports 3000 and 9229 respectively.
Port 9229 is the default debug port for Node.js but you can change it if necessary.
7. Step 5 – Debugging with VS Code
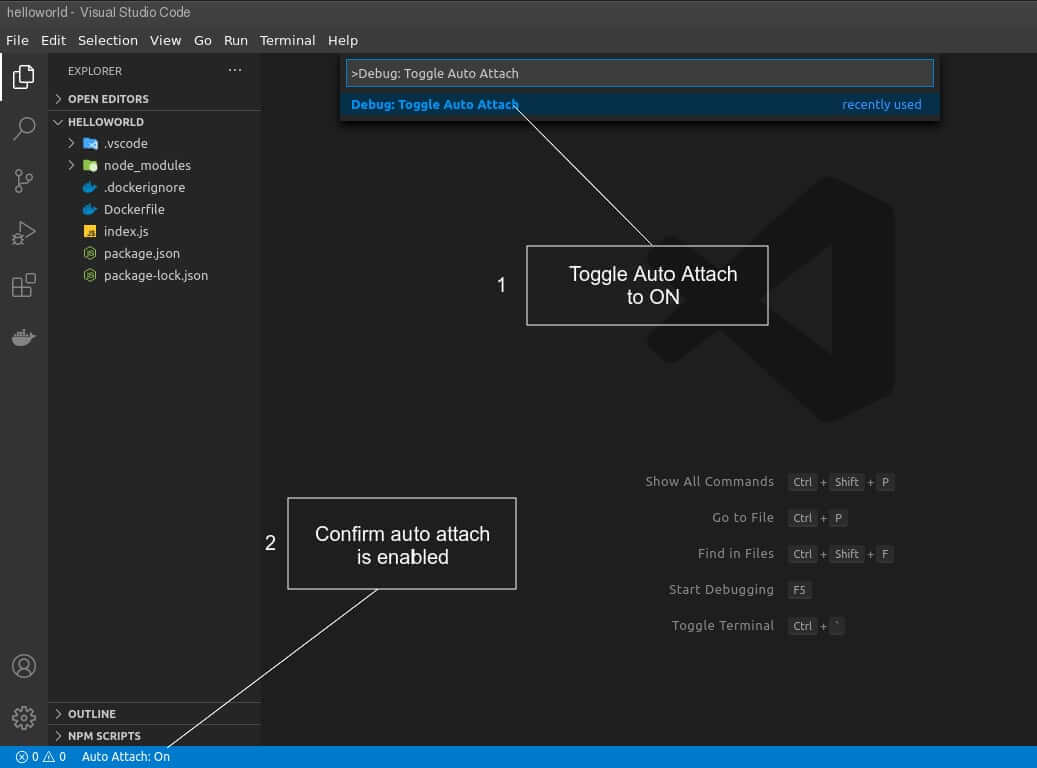
To debug your app in VS Code, make sure Node: Auto Attach setting is on. It enables VS Code to connect to your running app. To enable it, open the Command Pallete (Ctrl+Shift+P) and search for Debug: Toggle Auto Attach.
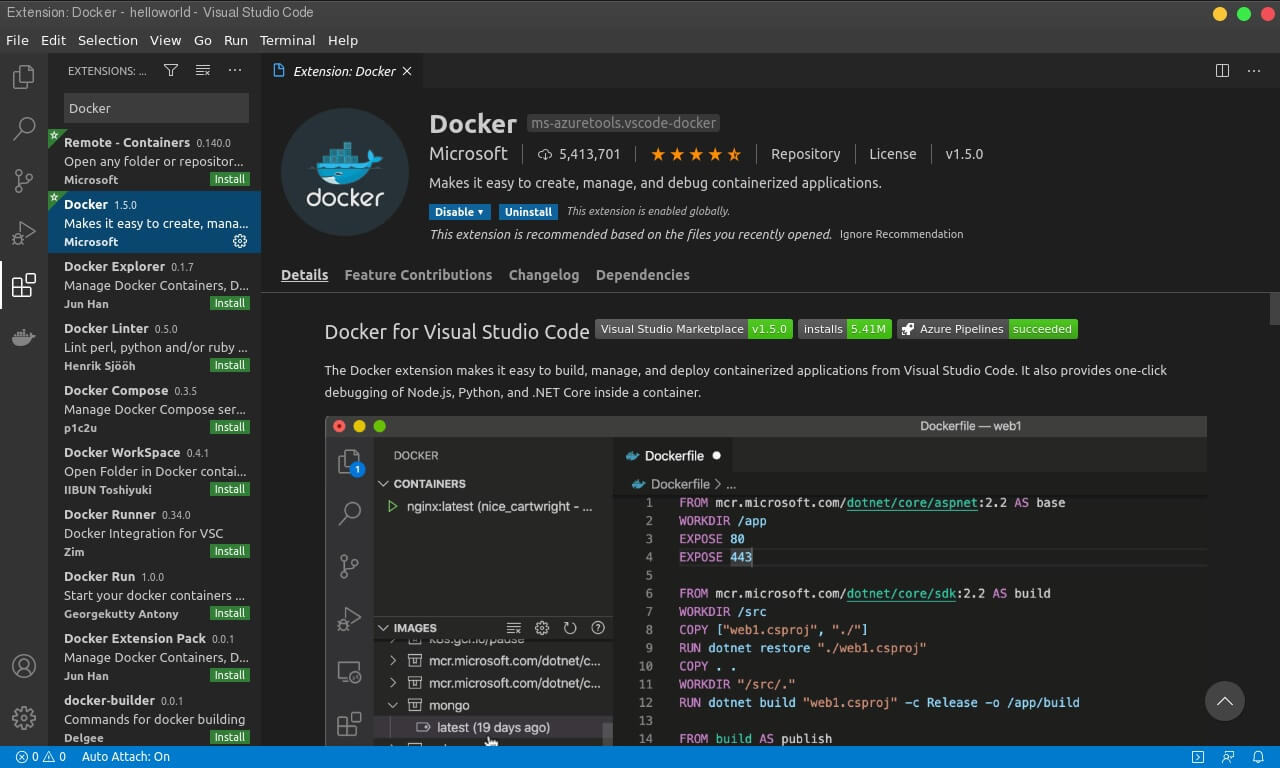
You will also require the Docker Extension. Open the Extensions tab and search for Docker and install it. The extension comes in handy in managing Docker images and containers.
Configure your launch.json to look like the snippet below. You can create a launch.json file by opening Command Pallete and searching for Debug: Open launch.json.
{
    "version": "0.2.0",
    "configurations": [
        {
            "name": "Docker: Attach to Node",
            "type": "node",
            "request": "attach",
            "port": 9229,
            "address": "localhost",
            "localRoot": "${workspaceFolder}",
            "remoteRoot": "/usr/src/app",
            "protocol": "inspector"
        }
    ]
}
If you are using Nodemon, add "restart":true under configurations. It will allow VS Code to automatically re-attach when your app reloads.
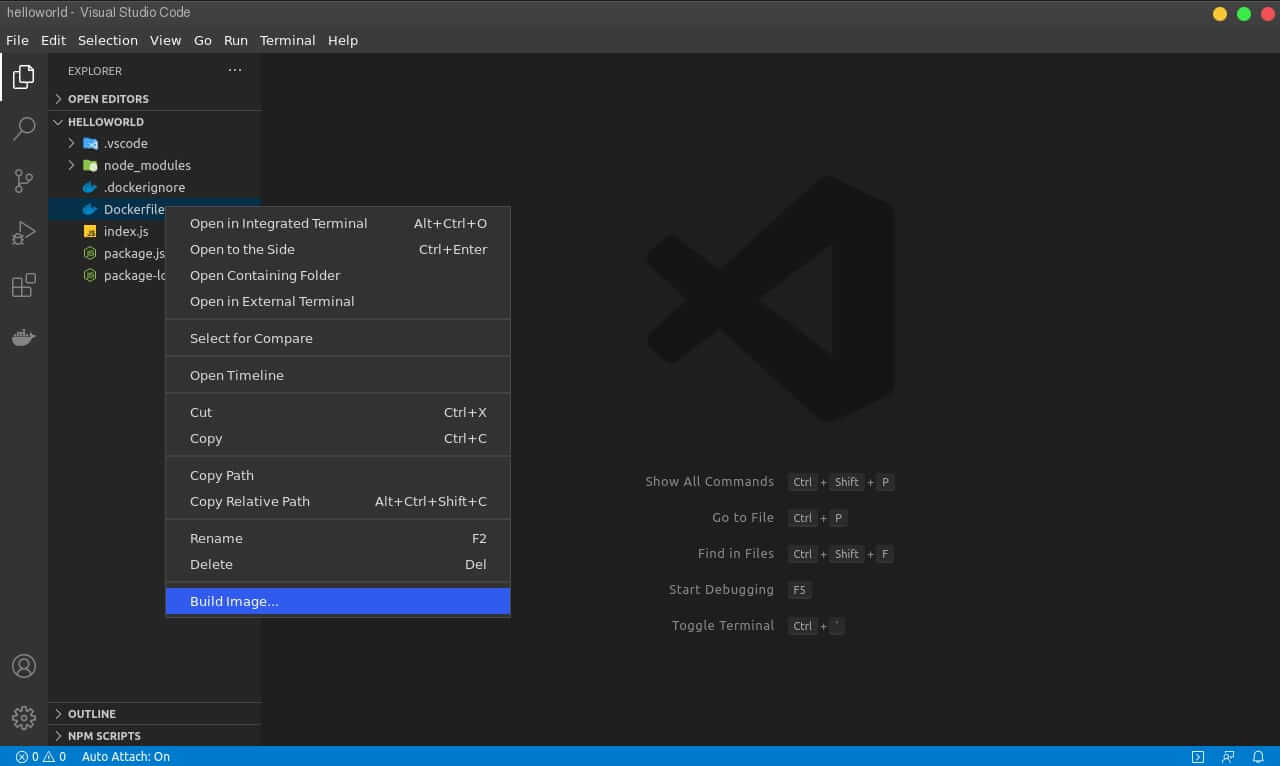
Build your Docker image using Docker extension or use the command docker build -t <your-image-name> .
Then, run it in a terminal exposing your ports:
$ docker run --rm -d -p 3000:3000 -p 9229:9229 image-name:tag
The
-dflag is used to run the container in “detached” mode. Therefore, you can use the same terminal to execute other commands.
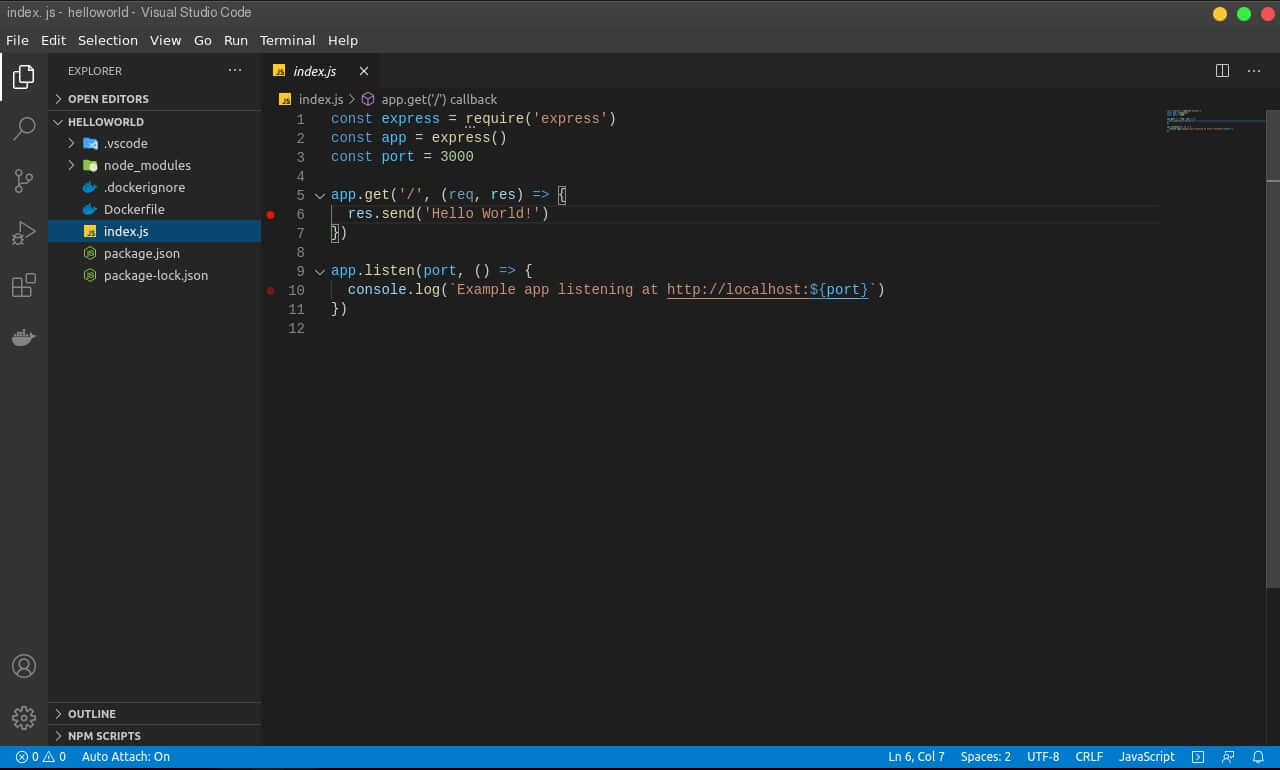
Open your file and set breakpoints by clicking on the left side of the number line. A red dot appears when a breakpoint has been set.
Open the debug panel by clicking on the bug icon in the activity bar. Click the play button or press F5 to attach VS Code to your running app. The bottom bar in VS Code will turn orange when successfully attached.
Open or reload the listening port for your app in a browser. You can also use the curl command to achieve the same effect.
$ curl http://127.0.0.1:3000
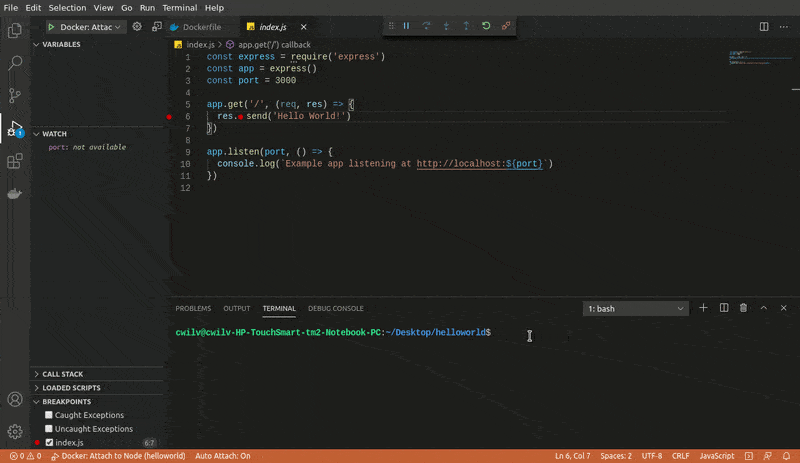
Upon hitting Enter, VS Code starts the debug session and pauses on the first breakpoint. You can use the continue button on the floating controls bar or F5 to resume execution. You can also watch variables in the watch pane.
8. Conclusion
In this tutorial, we looked at how you can debug your Node.js app running in a Docker container. You will need to add a debug script in your package.json to enable debugging in your Node.js app.
We looked at how you can use Nodemon to restart your app after making changes. Nodemon is useful in a development environment but not really useful in a production environment.
Debugging in Chrome DevTools doesn’t require many configurations. The only configurations are in the Dockerfile and package.json. It is suitable for one time debugging.
On the other hand, VS Code does require extra configurations. It’s more suitable for long-term debugging. You won’t have to open as many windows to debug your app.
Hope you found this tutorial helpful.
Happy coding!