
Table of Contents
Debugging Node.js code can prove challenging for many people. It often involves putting console.log on every corner of your code. But, what if I were to tell you there is a simpler method? In this article, we will be looking at how you can use VS Code to debug a Node.js application.
1. Meet the Savior
Visual Studio Code (VS Code) is a code editor made by Microsoft that is used by developers worldwide due to the many tools and features it offers. Its features can be further enhanced by the use of extensions. VS Code can also be used to debug many languages like Python, JavaScript, etc. and has made debugging Node.js apps a very simple and straightforward process.
Before proceeding, make sure you have the VS Code editor installed on your computer. If not, download the latest version from here.
2. The Setup
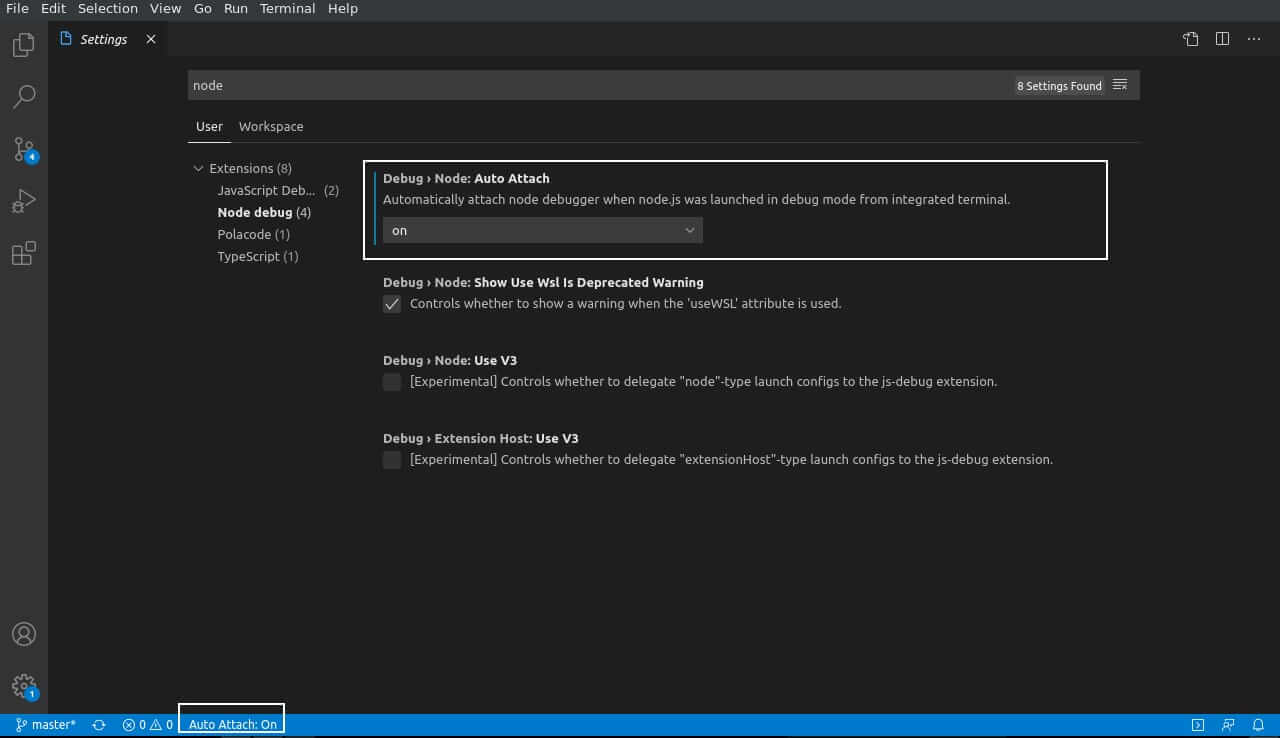
Open the Settings by pressing CTRL+,. You can also open the Command Palette (Ctrl+Shift+P) and type Preferences: Open Settings(UI), or find the gear icon in the lower left corner of the interface. In the search box, type in “Node.js”. On the left side under Extensions, click Node debug. Look for Debug > Node: Auto Attach. It is set to disabled by default. Click it and set it to on. This will always be enabled for Node.js applications from now on. You can look for an Auto Attach: On statement at the bottom blue bar in VS Code to confirm.
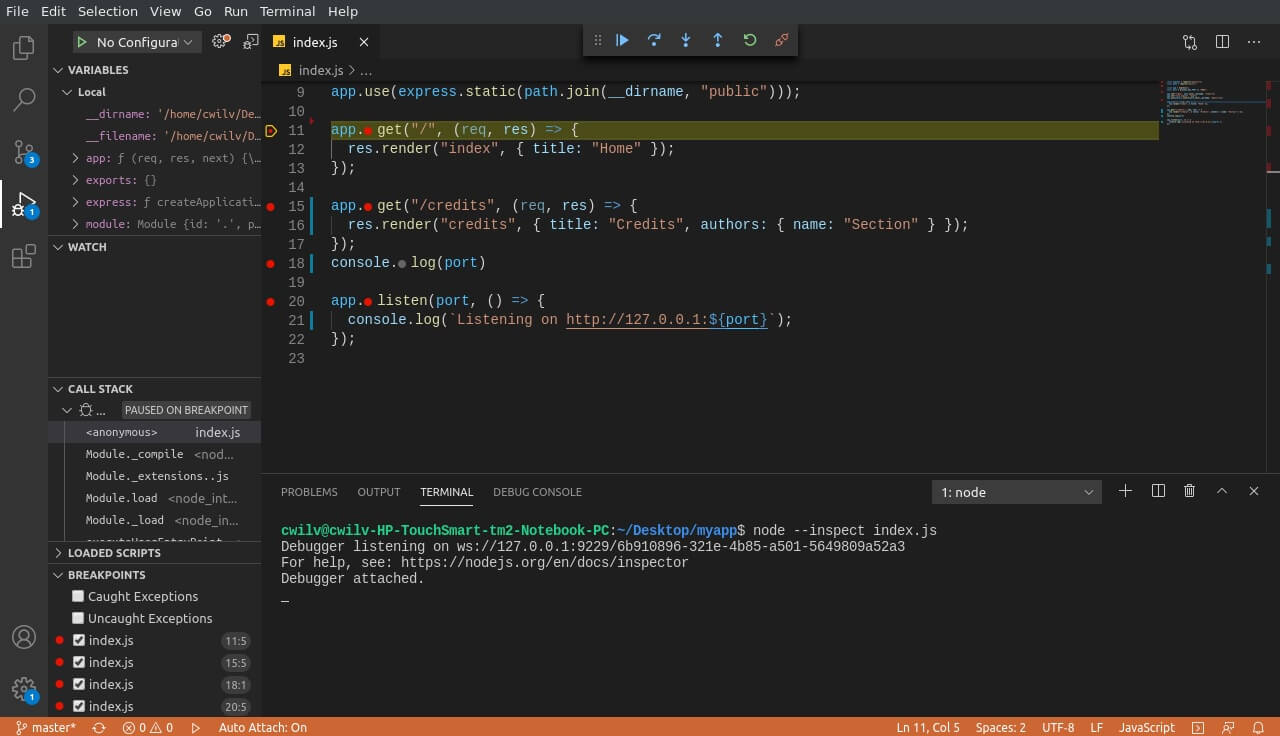
Next, open the Node.js file you want to debug and set some breakpoints. Do this by clicking on the left side of the line numbers where you would like your code to stop. A red dot will appear when a breakpoint has been set. Breakpoints will aid in identifying the line or region where your code is failing. You can place them in between suspected regions or randomly if you have no idea where the bug is hiding.
Open the debug panel by clicking the bug icon on the activity bar. You can also press Ctrl+Shift+D to open the same panel.
3. Debugging without Configurations
If no prior configurations have been made, there are 2 tabs in the debug panel. Run and Breakpoints. In the “Breakpoints” panel you can activate and deactivate your breakpoints using the checkboxes. In the “Run” tab, there are 2 options, Run and Debug and Node.js Debug Terminal.
Click “Node.js Debug Terminal” to open the built-in terminal. Switch to the debug console usingCtrl+Shift+Y or by pressing “Debug Console”. This is where you will view the debug logs. To start the debugging process, press the Run and Debug button on the debug panel and select Node.js if prompted. You can also run the app on a terminal using the --inspect flag like this node --inspect <filename>.
4. Debugging with Configurations
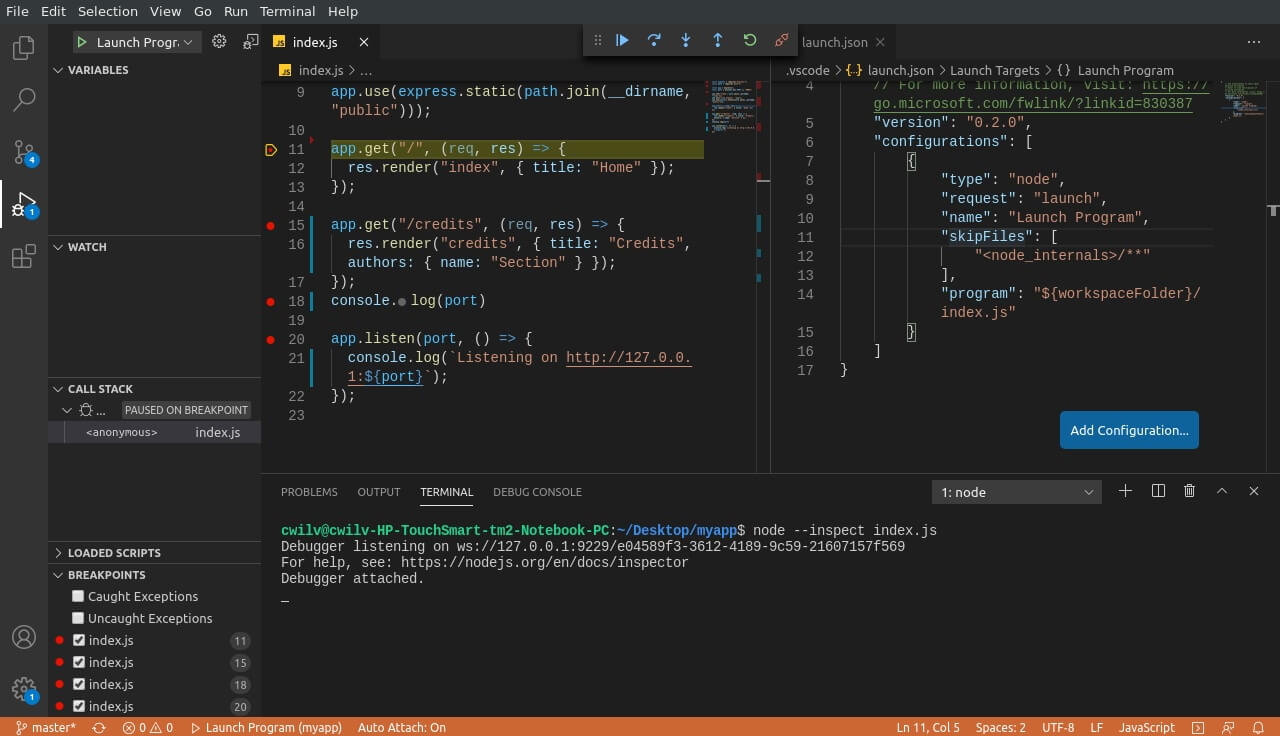
Press create a launch.json and select Node.js in the prompt to create a launch.json configurations file. You can also create it via Run>Add Configuration and select Node.js. By default, it contains the following content:
{
	// Use IntelliSense to learn about possible attributes.
	// Hover to view descriptions of existing attributes.
	// For more information, visit: https://go.microsoft.com/fwlink/?linkid=830387
	"version": "0.2.0",
	"configurations": [
		{
			"type": "node",
			"request": "launch",
			"name": "Launch Program",
			"skipFiles": [
				"<node_internals>/**"
			],
			"program": "${workspaceFolder}/<your opened file>"
		}
	]
}
You can add more configurations via the floating “Add configuration” button. (Learn more about the different options available here.) The configurations tell VS Code how to handle debugging.
Then run the app in a terminal using the --inspect flag like this node --inspect <filename>. Example: node --inspect server.js. You can also start the debugger by pressing F5.
5. Debug with Nodemon
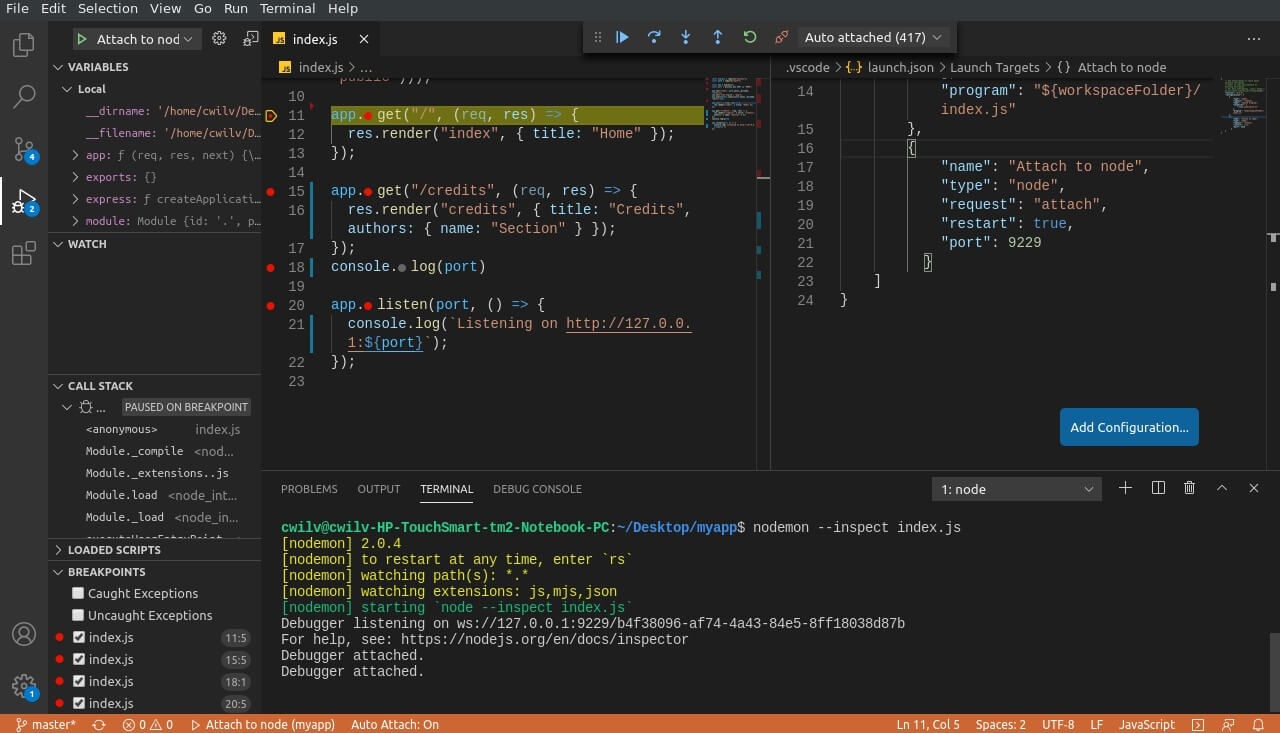
Nodemon is a tool that auto-reloads the server and reattaches the debugger after you make changes to your app. You can install it via npm using npm i nodemon. Then add the following under configurations in your launch.json.
{
  "name": "Attach to node",
  "type": "node",
  "request": "attach",
  "restart": true,
  "port": 9229
}
You can then launch your app normally, replacing node with nodemon. Example: nodemon --inspect <filename>.
If you get this error: nodemon: command not found, it means nodemon was not installed properly. Try using this: sudo npm install -g --force nodemon, which worked in my case.
If you are using Windows, npm i -g nodemon should work. Edit and save your app to see nodemon in action. You can then continue with the debugging process below.
For more on using nodemon and VS Code, click here.
6. The Debugger in Action
The terminal prints some lines along with Debugger Attached. The bottom blue bar color in VS Code turns to orange after the debugger is attached to your app. There also appears a floating button with play/pause, restart, and stop at the top center in VS Code.
The debugger pauses at the first breakpoint. You can follow through and resume the process using the play button. The debugger prints all console.log instances in your code to the debug console. If the app breaks, the logs will be shown in the debug console.
7. Conclusion
In this article, we have looked at how you can more easily debug your Node.js app using VS Code. VS Code comes in handy especially if you don’t like to switch between programs and windows. From now on, I hope it won’t be a problem debugging Node.js apps, especially if you are already a VS Code user.